Use DRH Tools Locally
The DRH Edge platform is designed for localized data handling and is ideal for the following scenarios:
Local Data Preview and Analysis
- Allows users to preview study data, analyze metrics, and view charts directly on their local machines.
- Ensures secure data exploration in a controlled, offline environment without the need for external data sharing.
Supported Operating Systems
The DRH Edge Platform runs on Linux and macOS. The table below clarifies what is and is not supported:
| Environment | Support Status |
|---|---|
| Native Linux (Ubuntu, Debian, and most distributions) | ✅ Fully Supported |
| Linux under WSL on Windows (Ubuntu, Debian, etc.) | ✅ Fully Supported |
| macOS | ✅ Fully Supported |
| Native Windows (PowerShell, CMD, without WSL) | ❌ Not Supported |
Note: :
- WSL (Windows Subsystem for Linux) is simply a way to run Linux on Windows — it is built into Windows and requires no extra licensing.
- When DRH Edge runs inside WSL, it is running on Linux. “Not supported on Windows” specifically means native Windows shells such as PowerShell or CMD without WSL.
Using DRH Edge Software
If you prefer to use the DRH Edge software for local data processing and visualization, please follow these steps:
-
Meet the Edge Usage Prerequisites
- DRH recommends using the suggested file structure for organizing your files. Alternatively, provide the DRH technical team with detailed information about your file structure and column patterns in advance.
- This information is essential for selecting or developing the appropriate Spry runbook for your dataset.
-
Select or Request a Runbook
- The platform uses executable Markdown files (Spry Runbooks) to orchestrate the full pipeline. Pre-built runbooks are available for common device types (e.g., Dexcom Clarity, Simplera).
- If your dataset structure is unique, the DRH technical team can develop a custom runbook tailored to your organization’s file patterns.
-
Verification and Upload
- After running the pipeline and generating the database, verify the results using the built-in SQLPage dashboard.
DRH Edge UI Setup and Data Transformation
This guide explains how to set up the DRH Edge platform and run the full data pipeline — from raw CSV files through validation, ETL, and into an interactive local dashboard.
The DRH Edge platform converts your CSV study files into a structured SQLite database, performs validation and quality checks, and presents results through a SQLPage web interface — all within your own environment.
Supported Operating Systems
See the Supported Operating Systems section above.
Prerequisites
Ensure the following tools are installed before proceeding. Each tool must meet the minimum version requirement.
| Tool | Role | Documentation |
|---|---|---|
| Python 3.8+ | Primary language for Singer Taps and the drh-target package. | Python.org |
| Spry | Orchestrates tasks (bash/SQL) defined in Executable Markdown files. | Spry Docs |
| Surveilr (v3.10+) | The engine for data ingestion, OTel trace collection, and pipeline orchestration. | Surveilr Docs |
Installation & Version Verification
Install each tool using the instructions below, then run the corresponding verification command to confirm the correct version is active.
Python 3.8+
Ubuntu / Ubuntu under WSL:
sudo apt update && sudo apt install -y python3 python3-pip python3-venvmacOS:
brew install pythonVerify:
python3 --version
# Expected output: Python 3.8.x or higher
Spry
Follow the installation steps at Spry Docs.
Verify:
spry --versionSurveilr (v3.10+)
Follow the installation steps at Surveilr Docs.
Verify:
surveilr --version
# Expected output: surveilr v3.10.x or higher
Getting Started
Step 1: Clone the Repository
git clone https://github.com/diabetes-research/spry-drh-edge-platform.git
cd spry-drh-edge-platform/drh-edge-core
Step 2: Organize Your Study Data
Before running the pipeline, verify your dataset is organized correctly.
Your dataset folder must contain the following files:
- Study Metadata — general study information
- Participant Data — subject demographics
- CGM File Metadata — metadata for individual tracing files
- CGM Tracing Files — raw glucose data (e.g.,
cgm_tracing_001,cgm_tracing_002, …)
The folder structure should look like this:
raw-data/
└── your-study/
    ├── study.csv
    ├── participant.csv
    ├── cgm_file_metadata.csv
    ├── cgm_tracing_001.csv
    ├── cgm_tracing_002.csv
    └── ...
Note: File structures and naming conventions must follow the DRH Data Organization Standard.
Copy your dataset into a new sub-directory under raw-data/:
cp -r /path/to/your/study raw-data/your-study/Step 3: Configure Your Environment
Select the executable Markdown runbook that matches your data type:
| Device / Data Type | Runbook File |
|---|---|
| Synthetic Simplera CGM | drh-simplera-cgm-systems.md |
| Synthetic Dexcom Clarity | drh-dexcom-clarity.md |
| Physionet CGMACROS | drh-physio-cgmacros.md |
| Custom dataset | Contact the DRH technical team |
Open the selected .md file and update the prepare-env task block with your values:
STUDY_DATA_PATH="raw-data/your-study/"
TENANT_ID="YOUR_LAB_ID"
TENANT_NAME="Your Research Lab Name"
Then run:
spry rb task prepare-env [your-runbook].mdExample:
spry rb task prepare-env drh-simplera-cgm-systems.mdStep 4: Clean Your Environment
Before running the pipeline, reset the environment to avoid file permission errors or stale data from previous runs:
./reset.shThis script:
- Marks all Singer Tap Python files as executable
- Removes any existing
resource-surveillance.sqlite.db - Deletes temporary UI and artifact files
Step 5: Execute the Pipeline
Run the full orchestration — Pre-validation → Ingestion → ETL → UI Packaging:
spry rb task prepare-db-deploy-server [your-runbook].mdExample:
spry rb task prepare-db-deploy-server drh-simplera-cgm-systems.mdStep 6: Launch the Dashboard
surveilr web-uiOpen http://localhost:9227 in your browser to view demographics, CGM trends, validation reports, and de-identification logs.
If port 9227 is already in use:
sudo kill $(sudo lsof -t -i:9227)Step 7: Verify the Diagnostics Results in the UI
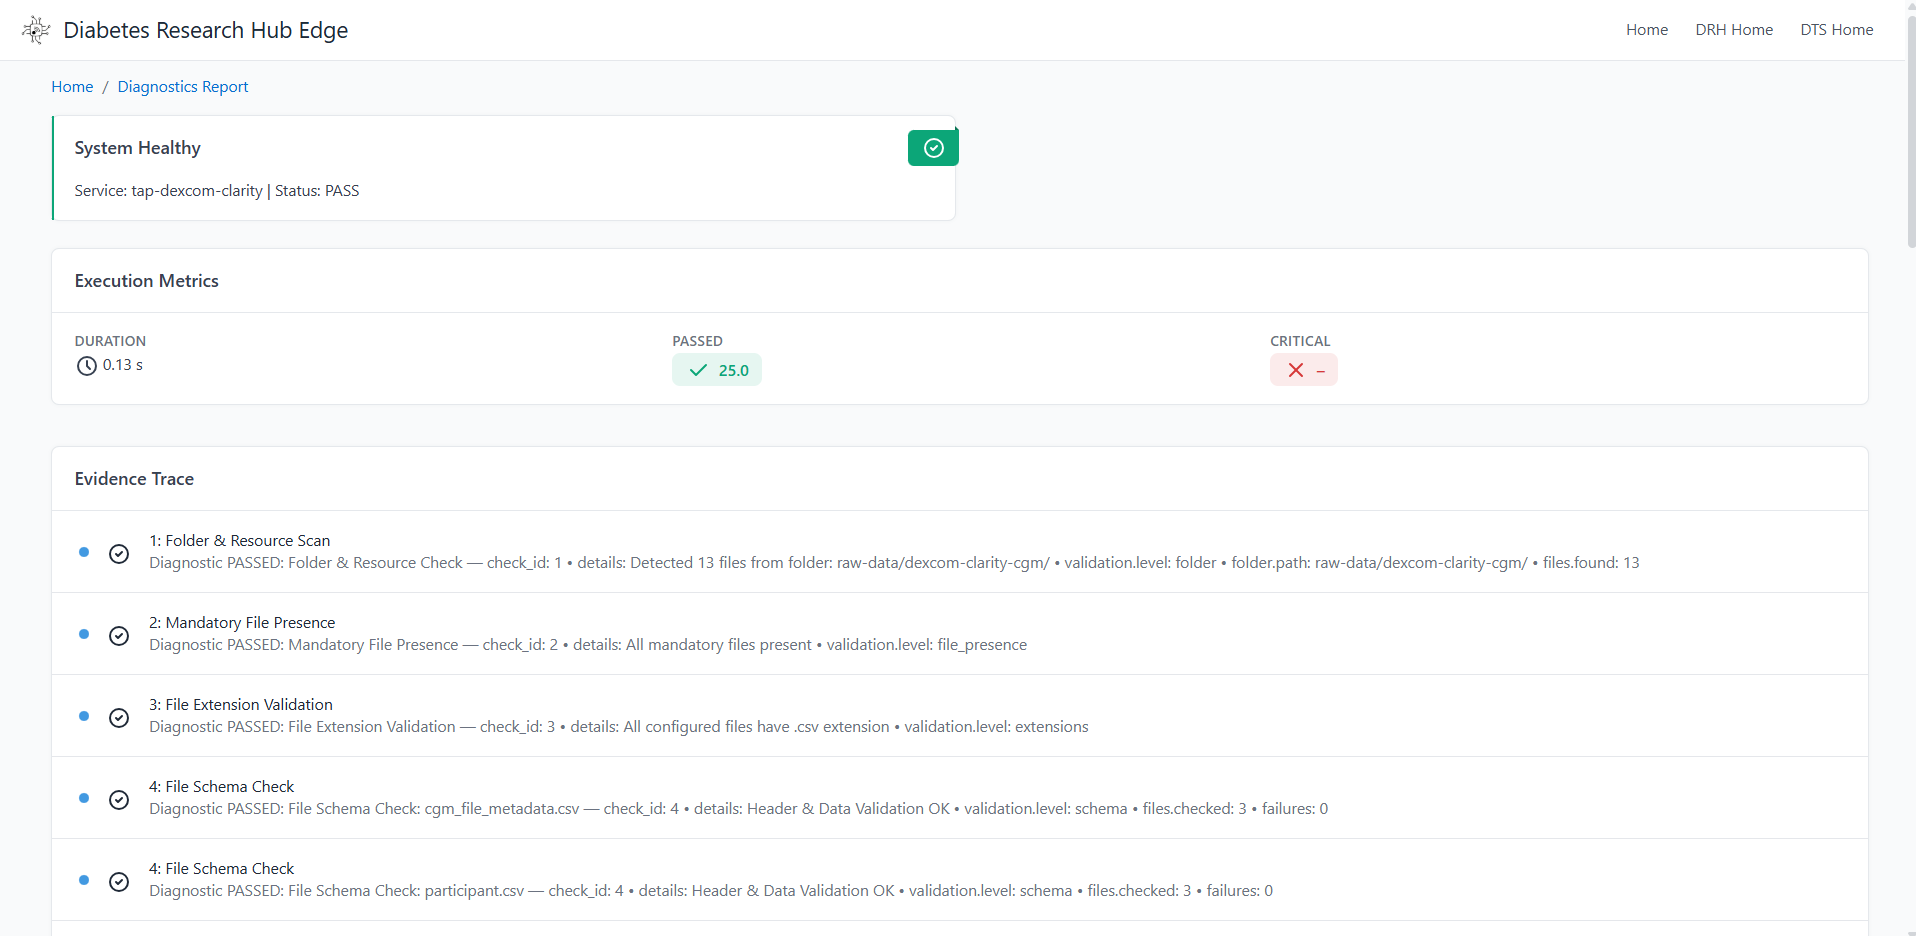
Check the Diagnostics section of the dashboard. If the overall_status shows FAIL, the ETL will be blocked and row-level diagnostic details will be displayed to help identify the issue.
Standard Workflow Summary
| Step | Command |
|---|---|
| 1. Clean | ./reset.sh |
| 2. Configure | spry rb task prepare-env [your-runbook].md |
| 3. Execute | spry rb task prepare-db-deploy-server [your-runbook].md |
| 4. Launch Dashboard | surveilr web-ui |
Port & Database Management
- Close External Viewers: Ensure
resource-surveillance.sqlite.dbis not open in any external tool (such as DB Browser for SQLite) while asprytask is running — this prevents the engine from writing to the file. - Gated Execution: If a previous run failed at the Validation Gate, run
./reset.shbefore retrying to start from a clean state. - Multiple Datasets: To run a different dataset, copy the base runbook, update the environment variables, and execute using the new file:
cp drh-simplera-cgm-systems.md study-x-etl.spry.md
spry rb task prepare-env study-x-etl.spry.md
spry rb task prepare-db-deploy-server study-x-etl.spry.md
Dataset Preparation Aides
For complex datasets like PhysioNet CGMacros, the platform provides specialized Python aides to transform raw data into DRH-standard CSVs before ingestion. To access the technical specifications and development prompts for the dataset preparation aides, you can use the following links to the specialized documentation files within the repository:
| Aide Script | Purpose | Documentation Link |
|---|---|---|
| Supporting Files Generator | Creates relational CSVs (institutions, investigators, labs) from text specs. | Gen-Spec-Support.md |
| Required Files Generator | Automatically derives cgm file metadata, study, and participant CSVs based on the dataset. | Gen-Spec-Content.md |
Workflow Context
As highlighted in the platform documentation, these aides are positioned at the start of your data journey: Raw Data → [Preparation Aides] → Standard CSVs → [Runbook Pipeline] → Dashboard.
Key References for Implementation
- Aide Logic: The documentation links above include the clinical logic used to derive ICD-10 codes and diabetes types automatically from raw glucose markers.
- Runbook Orchestration: Once the CSVs are generated, use the
drh-physio-cgmacros.mdrunbook to execute the ingestion and ETL tasks. - System Requirements: Ensure you are using Surveilr v3.34.0 or more for the most stable experience with these preparation tools.
🤖 Local AI Research Assistant (MCP)
The DRH Edge platform is “AI-Ready.” By supporting the Model Context Protocol (MCP), it allows you to connect your local study database to an AI Research Assistant of your choice. This brings advanced clinical reasoning directly to your data while maintaining 100% local privacy.
Privacy-First Clinical AI
- Local Reasoning: Your sensitive research data stays on your machine. The AI only sees the specific data points required to answer your immediate question.
- Bring Your Own Assistant: Use your preferred AI client—such as GitHub Copilot, Claude Code, or Cursor—to interact with your data.
- Zero-Cloud Dependency: You do not need to upload your database to a cloud platform to get AI-driven insights, summaries, or visualizations.
How to Connect
To chat with your data, point your MCP-compliant AI client to your local database using a standard configuration.
📍 Local AI Connection Parameters (Universal Setup)
If you are using an AI client other than VS Code (such as Claude Code, Cursor, or Windsurf), use the following parameters to connect your assistant to the local DRH database.
[!TIP] Pro Tip for Researchers: Copy and paste these exact values into your AI client’s MCP configuration settings.
| Parameter | Value |
|---|---|
| MCP Server Command | surveilr |
| Arguments | mcp, server, -d, ./drh-edge-core/resource-surveillance.sqlite.db |
| Transport Type | stdio |
Example configuration for Claude Desktop (config.json):
"surveilr": {
  "command": "surveilr",
  "args": ["mcp", "server", "-d", "./drh-edge-core/resource-surveillance.sqlite.db"]
}
Common Researcher Prompts:
- “Summarize the demographics of enrolled participants.”
- “Check the overall_status from the session summary view using the query_sql tool.”
- “Create a Mermaid chart showing the Time-in-Range (TIR) for the last 14 days.”
🔒 Privacy & Security FAQ
Q: Is my research data being uploaded to the cloud for training? A: No. Your raw clinical database file remains strictly on your local machine. When you ask a question, the surveilr server processes the query locally and only sends the specific result back to the AI model to format the answer for you.
Q: Does the AI model “see” my whole database? A: The AI sees the “metadata” (the names of your columns and tables) so it can understand how to ask questions. It only sees actual data rows when it specifically requests them to fulfill your prompt.
Q: Can I use this completely offline? A: While the connection between your database and the AI assistant is local, most AI models (like Claude or GPT-4o) still require an internet connection to process the “reasoning” part of your request. However, the data access itself happens through a local pipe controlled by the surveilr binary.
🔗 Deep Dive Documentation
- For full setup templates, pathing guides, and prompting strategies, please refer to the: 👉 MCP Orchestration & Prompting Guide
Workflow Summary
| Step | Action |
|---|---|
| 1. Generate RSSD | Run the Spry runbook to build your local Study Database. |
| 2. Configure | Connect the surveilr MCP server to your AI client using the provided mcp.json. |
| 3. Chat | Use natural language to query tables. For Virtual Views, explicitly ask to use query_sql. |
| 4. Visualize | Request Mermaid charts for immediate clinical insights and trend analysis. |
Platform Visual Showcase
🏛️ Research Landing Page
The entry point provides a high-level summary of active studies, enrollment progress, and system health.
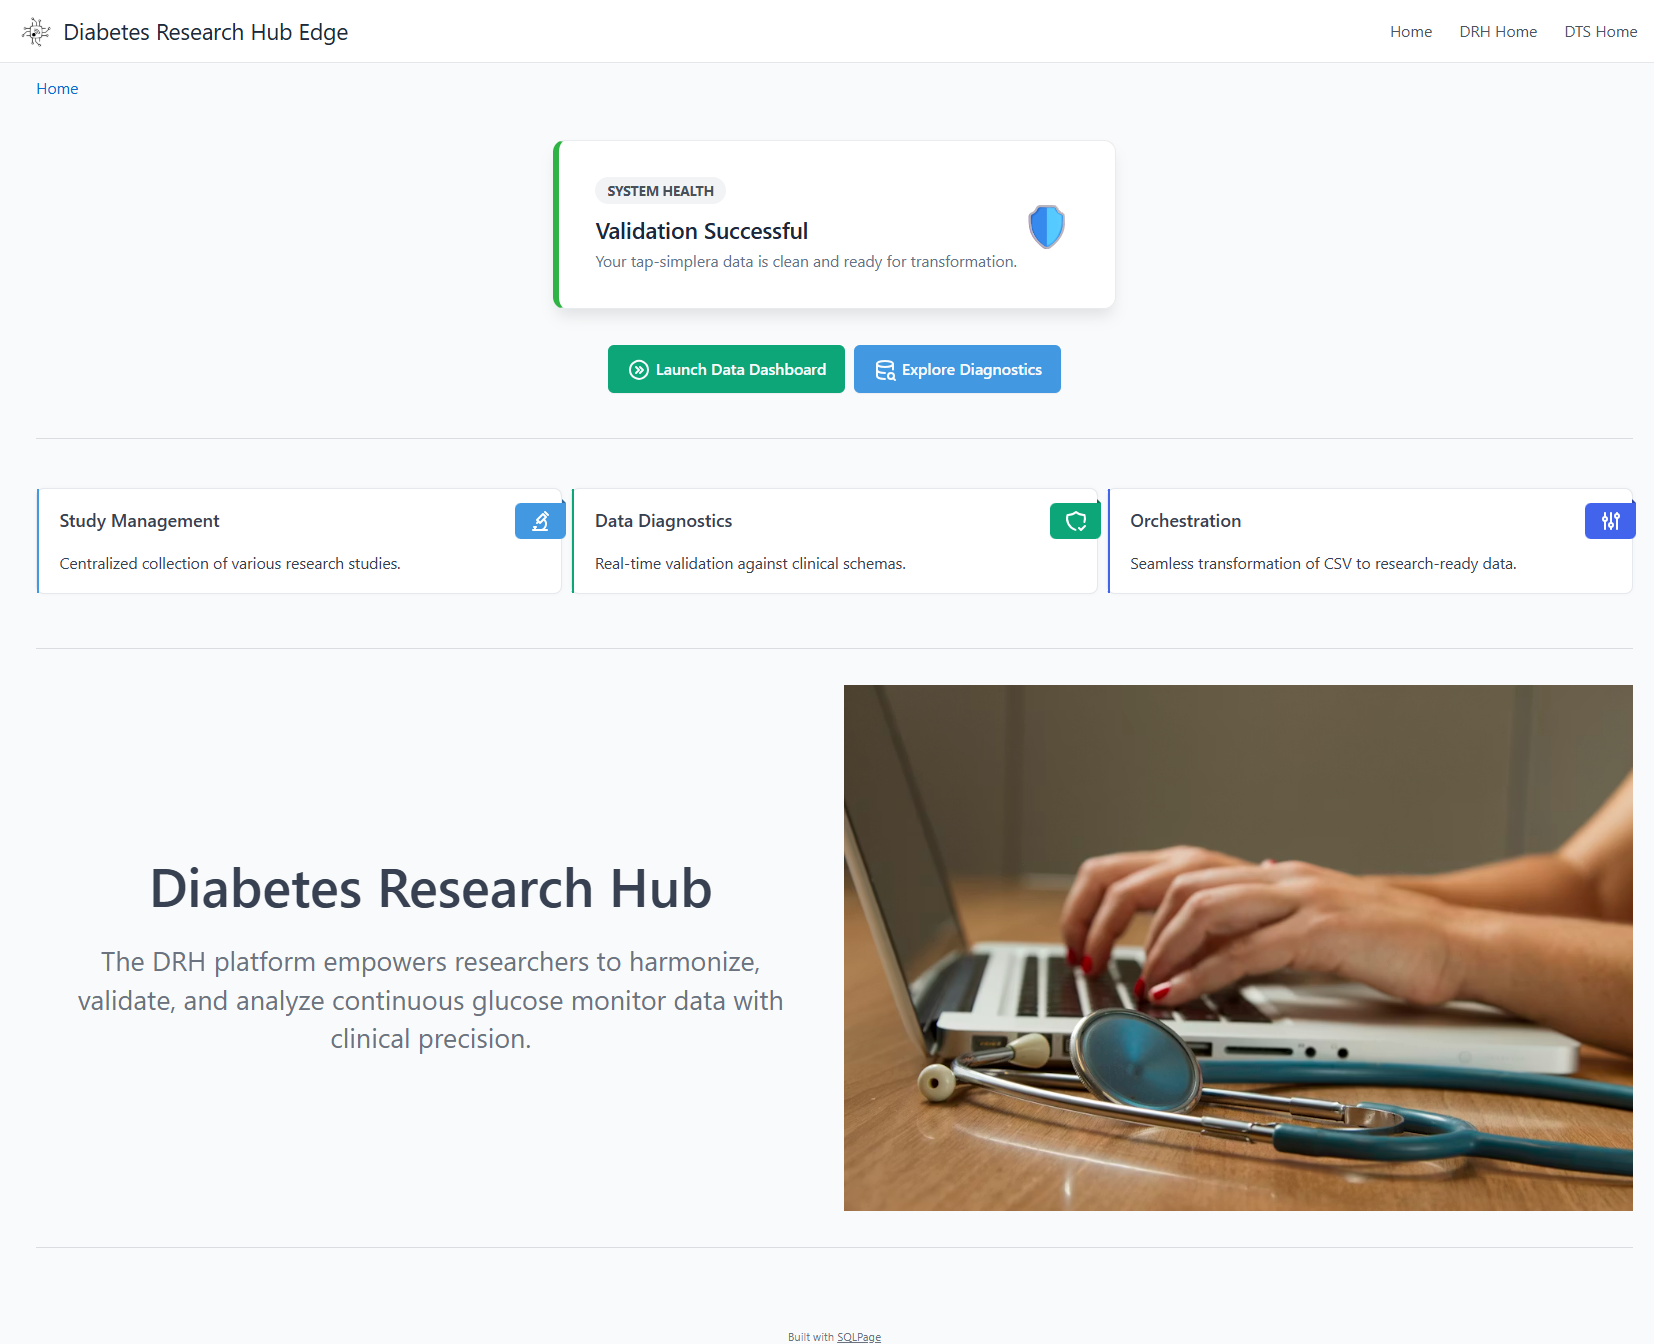
Overview of active studies, enrollment progress, and system health.
🔍 Validation Gate & Diagnostics
If incoming data violates clinical schemas or structural rules, the ETL is automatically blocked to prevent database corruption. Row-level diagnostic details are surfaced directly in the UI.
Schema validation and ETL gating with deep-link row-level diagnostics.
📊 Clinical Research Dashboard
Once data passes the validation gate, it is transformed into optimized relational tables for high-fidelity visualization and metric calculation.
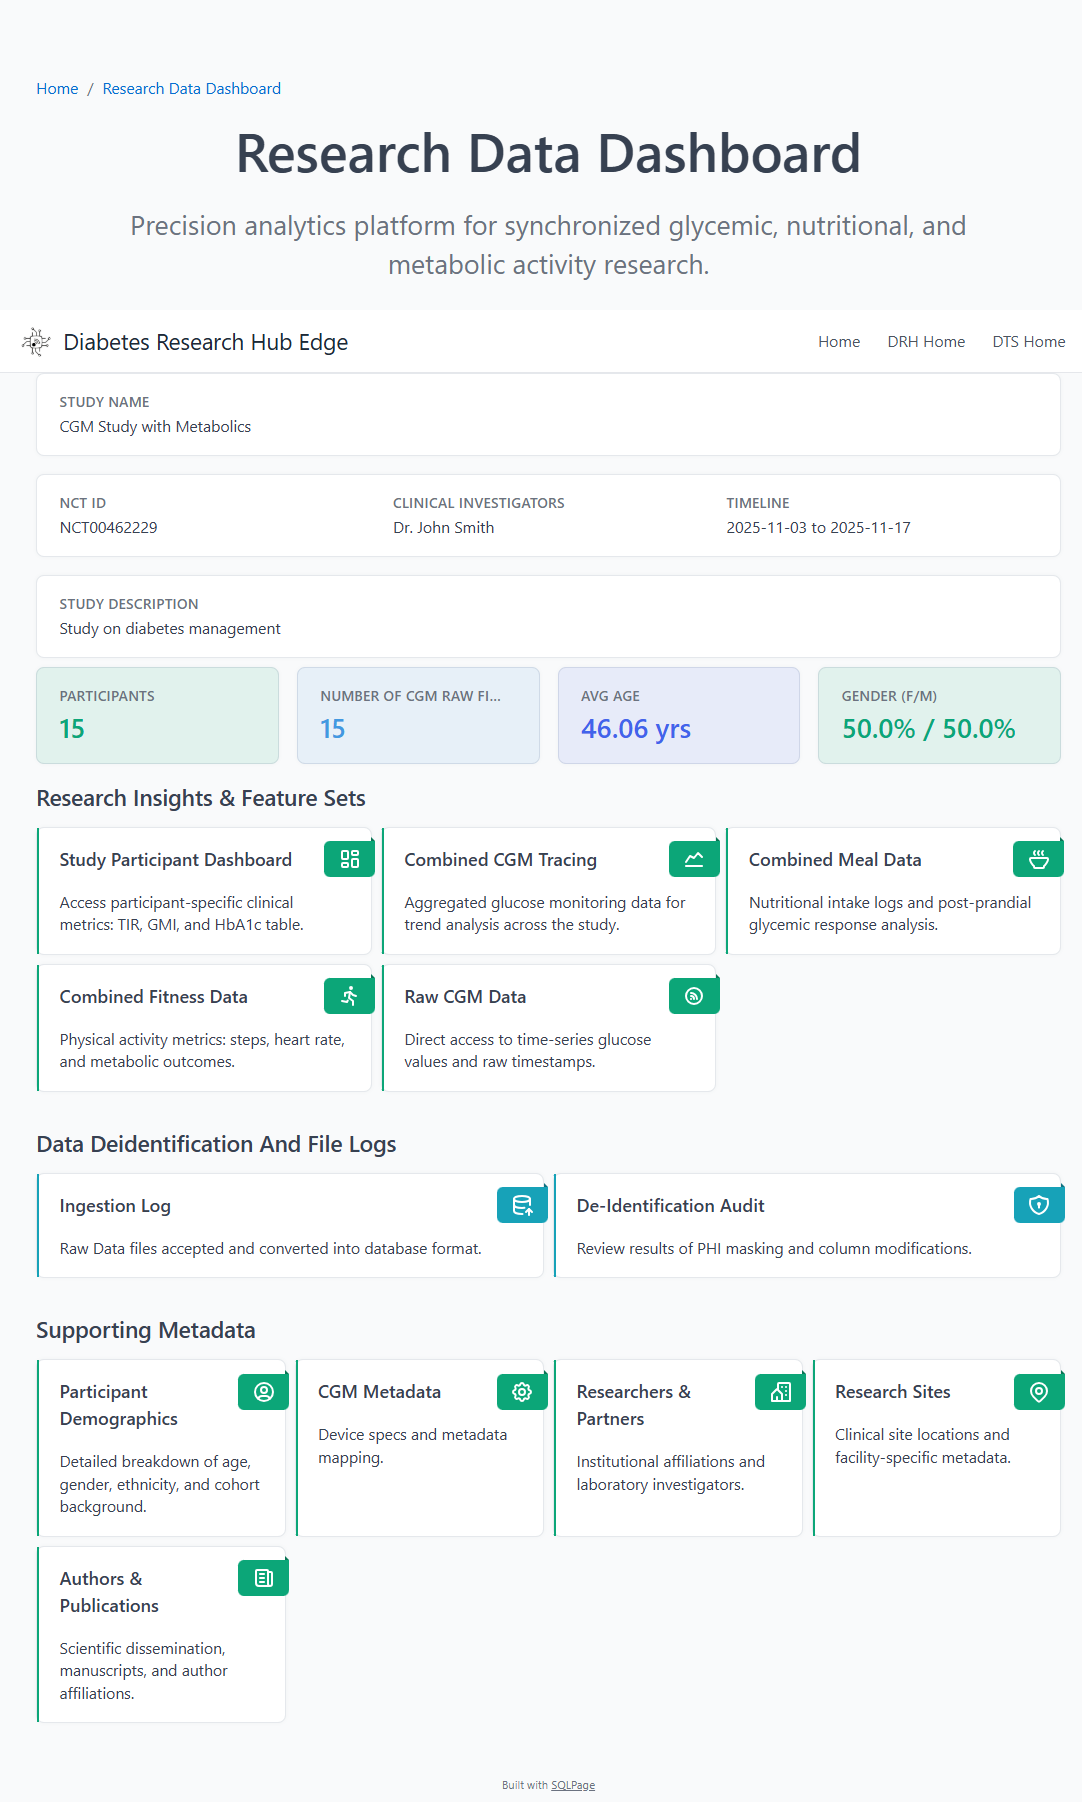
Participant demographics, enrollment metrics, and CGM analytics.
🛠️ Participant Drill-Down
Detailed drill-downs allow researchers to inspect individual participant traces, meal logs, and device performance metrics in a centralized view.
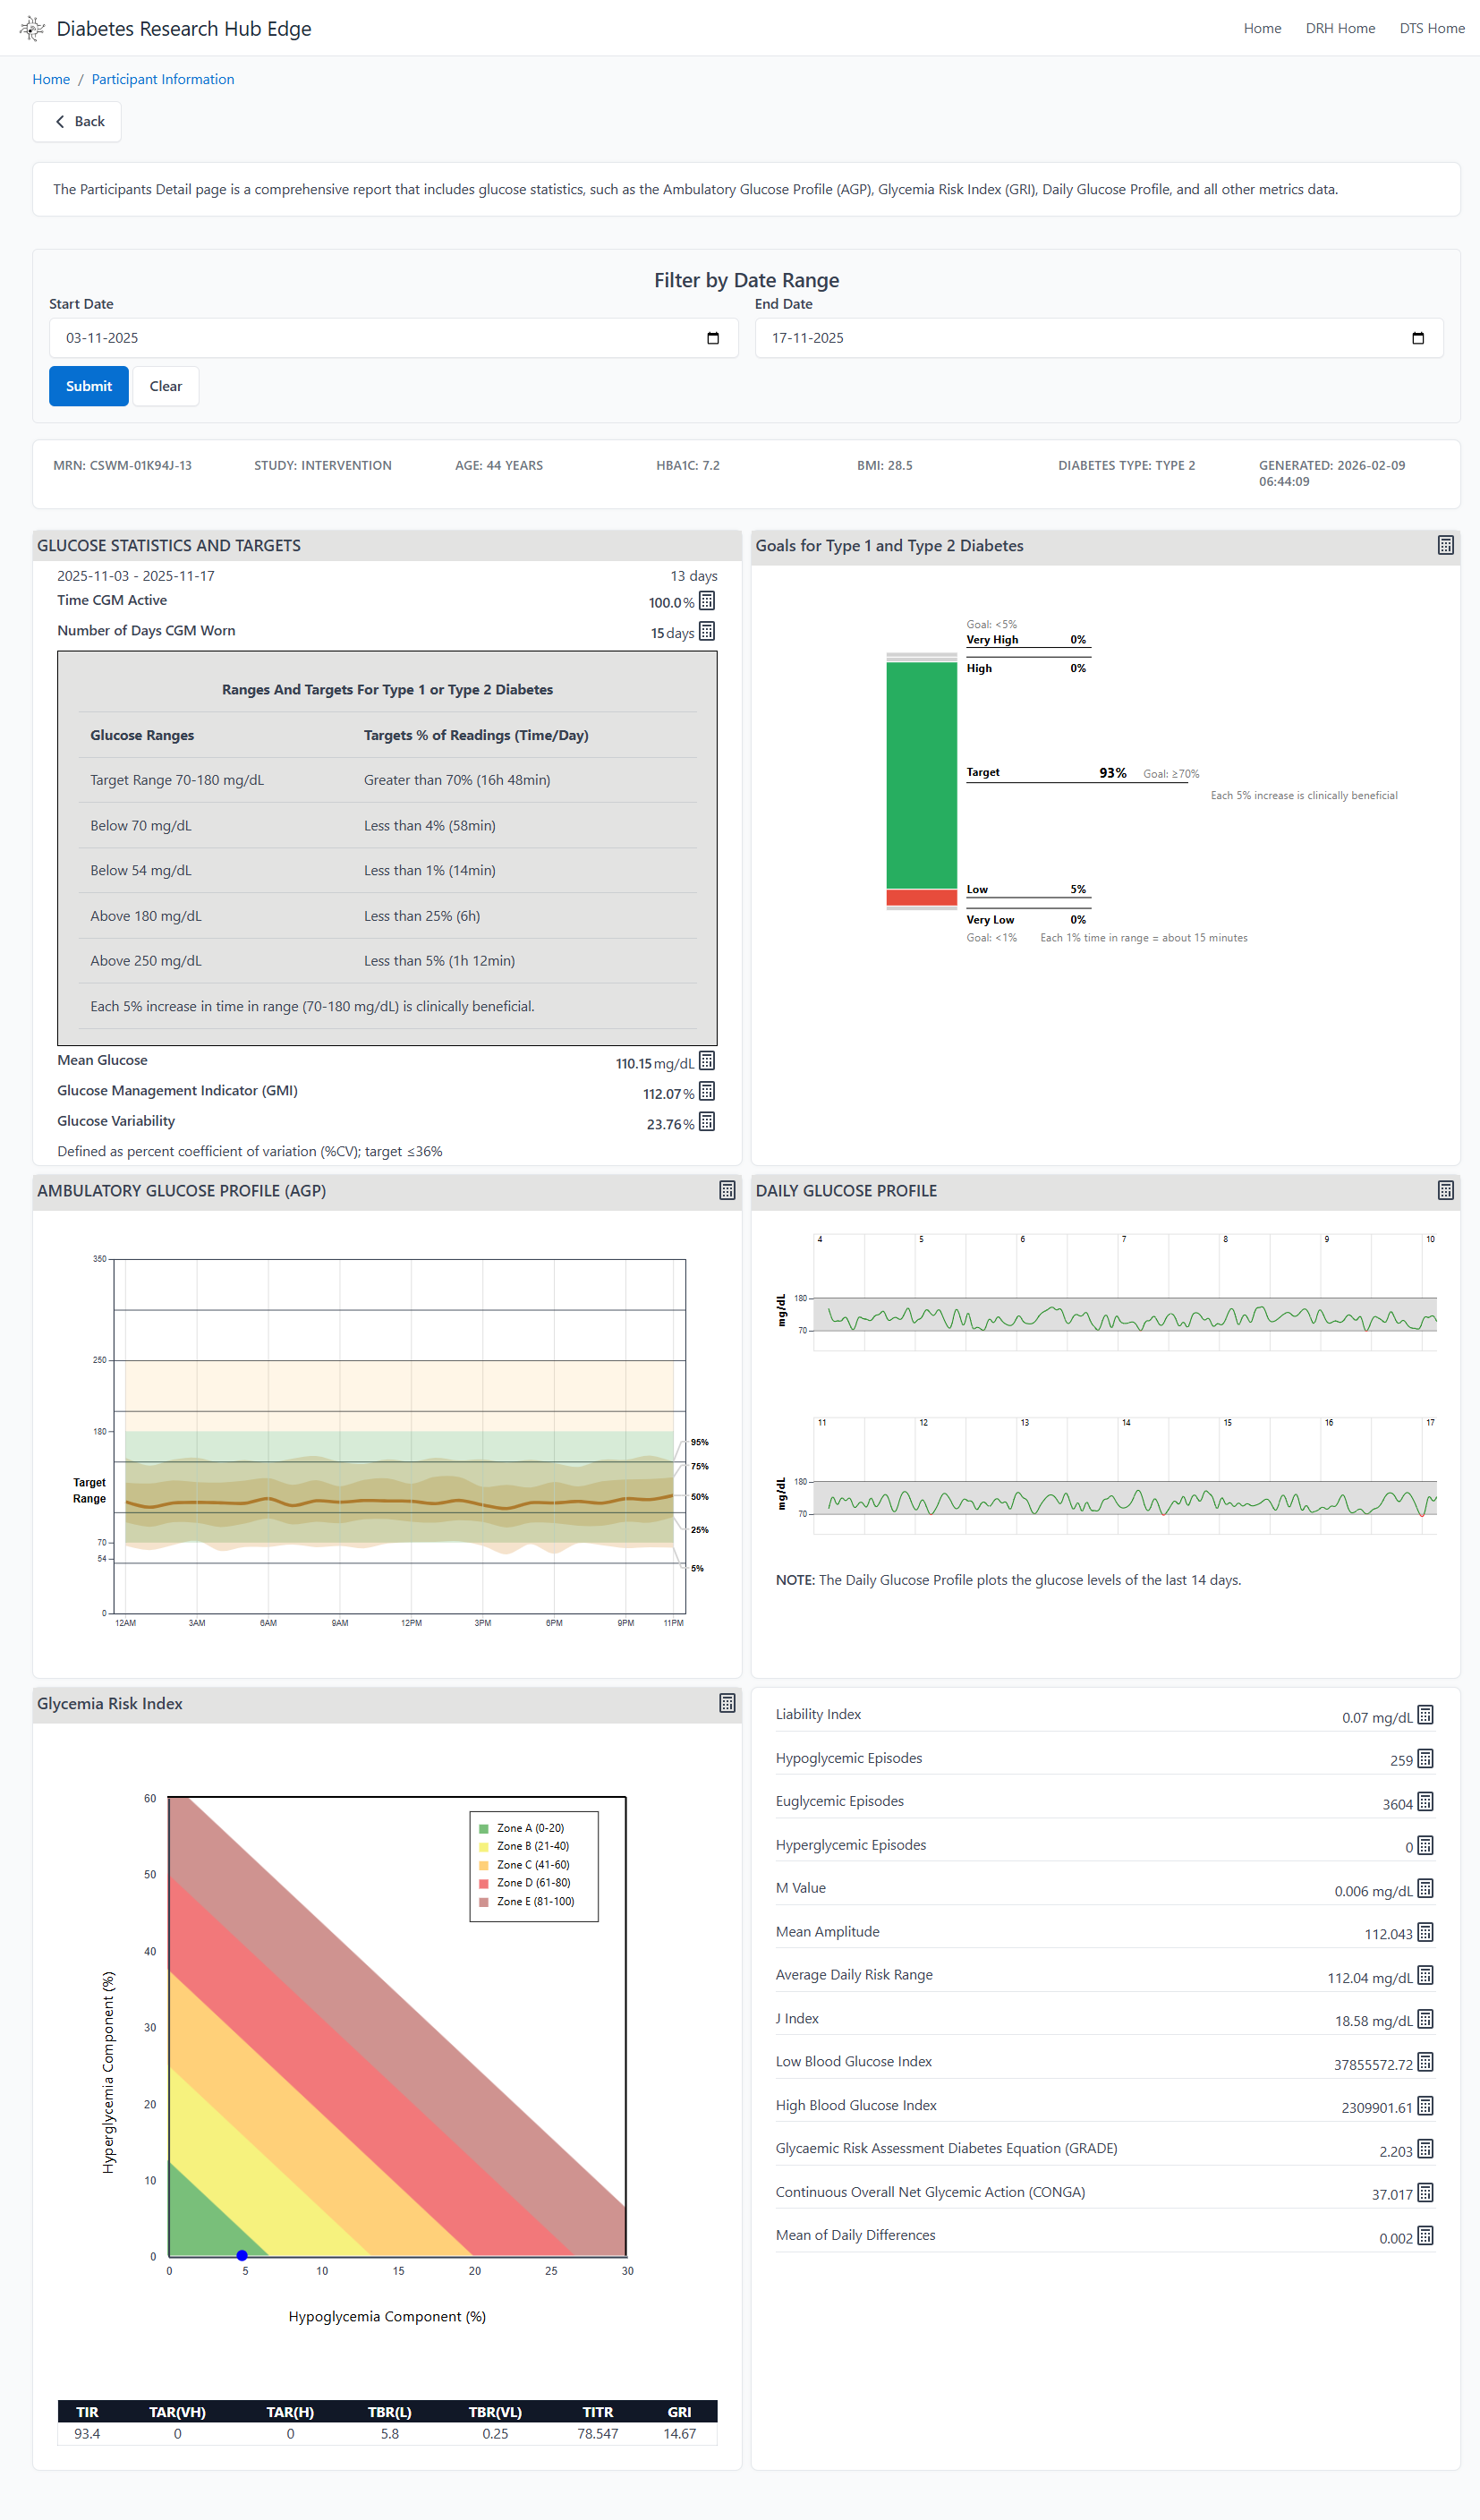
Detailed participant-level time-series data and device performance metrics.
Data De-identification
As part of the DRH Edge Platform, the ETL pipeline includes built-in capabilities for de-identifying and anonymizing sensitive data, ensuring compliance with privacy regulations before data is shared externally. This protects Personally Identifiable Information (PII) and Protected Health Information (PHI) while maintaining the data’s analytical value.
Why De-identification Is Important
Organizations handling Continuous Glucose Monitoring (CGM) data must comply with global privacy standards such as HIPAA (USA), GDPR (EU), and other applicable data protection laws. De-identification ensures that sensitive information — such as participant demographics and device identifiers — is secured before external sharing or publication.
De-identification in DRH Edge
The platform focuses on removing or masking direct identifiers . Masking is applied automatically during pipeline execution and is logged in the dashboard under the de-identification log view.
Common transformations include:
- Participant Name → Removed or replaced with a randomly generated identifier
- Date of Birth → Replaced with an age range or general birth year
- Email Addresses → Redacted or replaced with dummy values
- Device IDs → Hashed or replaced with a pseudonymized ID
Customization
Each customer’s file structure may vary. You can specify which columns require anonymization, and the DRH technical team will generate the necessary SQL scripts and incorporate them into a custom runbook for your organization.
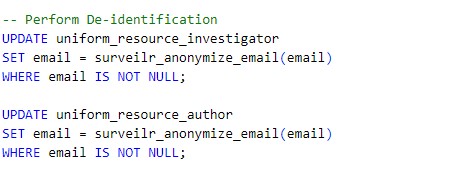
Example: The following SQL performs de-identification
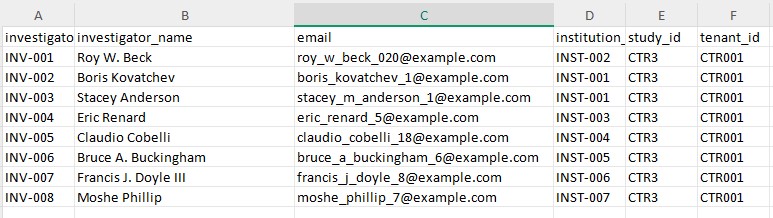
Before masking the investigator file
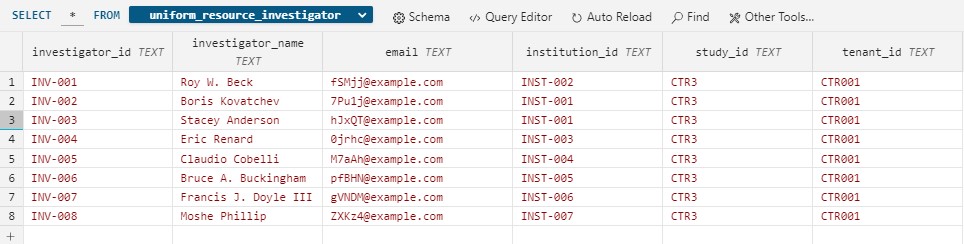
After masking
Tools for CSV File Validation
We recommend the following third-party open-source tools to validate whether your files adhere to the required structure before running the pipeline.
Data Curator
Data Curator is a lightweight desktop data editor designed to help describe, validate, and share open data. It offers a user-friendly graphical interface for editing tabular data while ensuring adherence to data standards.
Key Features:
- Schema Editing: Modify Frictionless JSON schemas to suit your project’s requirements.
- Load and Preview Data: Visualize and inspect CSV files before ingestion.
- Validate Against Schema: Perform schema validation using the Frictionless JSON specification.
- Edit and Save: Correct errors directly in the application and save validated data.
- Export Options: Share validated datasets as clean CSV files or complete data packages.
Open Data Editor (ODE)
The Open Data Editor is an online tool for non-technical users to explore, validate, and detect errors in tabular datasets. No installation is required.
Key Features:
- Online Access: Access directly through your browser.
- Error Detection: Quickly identify errors in table formatting and data values.
- Schema Validation: Validate datasets against predefined Frictionless JSON schemas.
- Interactive Editing: Fix errors and inconsistencies in real-time.
- Export Options: Save corrected files for further use or sharing.